Transcriptomics
The transcriptome represents the repertoire of transcripts in an organism as the main product of transcribed RNA. The Human genome comprises 3 billion bases on each of (on average 1014) cells in one body, where each cell may contain up to 300k RNA molecules. Then, the full transcriptome may contain approximately 8.423 RNA bases... in one body! One cell line/condition, translated to bioinformatics data, could imply 30Mb of microarray data or 30Gb of RNA-seq data, and all cells in one body from petabytes to exabytes. Transcriptomics studies have been traditionally carried out using microarray technologies and the emerging next generation sequencing techniques known as RNA-seq. The main problems and topics being addressed in my research in transcriptomics are summarized below.
Single-cell RNA-seq Data Analysis - Cell Type Identification
Single-cell sequencing (scRNA-seq) is an emerging technology used to capture cell-level information and by which individual cells can be analyzed separately. While many computational methods have been devised for analyzing scRNA-seq data, there are many open problems in this research area. One of the main scRNA-seq analytical challenges is finding cell types, highly differentially expressed tissue-specific gene sets, or gene-gene interarions, which currently we are working on. Among these, we focus on the identification of different cell types using manifold learning combined with clustering techniques on scRNA-Seq data. A proposed two-step approach reveals that genes with similar expression patterns are grouped in highly-scored clusters, achieving very high performance in most cases. Efficient nonlinear dimensionality reduction and manifold learning techniques based on modified locally linear embedding significantly improve the clustering step; the addition of independent component analysis enhances visualization in a reduced space.
The method has been tested on a scRNA-seq dataset (available at the GEO database, accession no. GSE148729), extracted from NCBI's Gene Expression Omnibus, which includes 27,072 gene expression profiles of 48,890 human lung cell lines sequenced using Illumina NextSeq 500. In this dataset, different cell lines were contaminated with SARS-CoV-1 and SARS-CoV-2 and sequenced at different time slots.
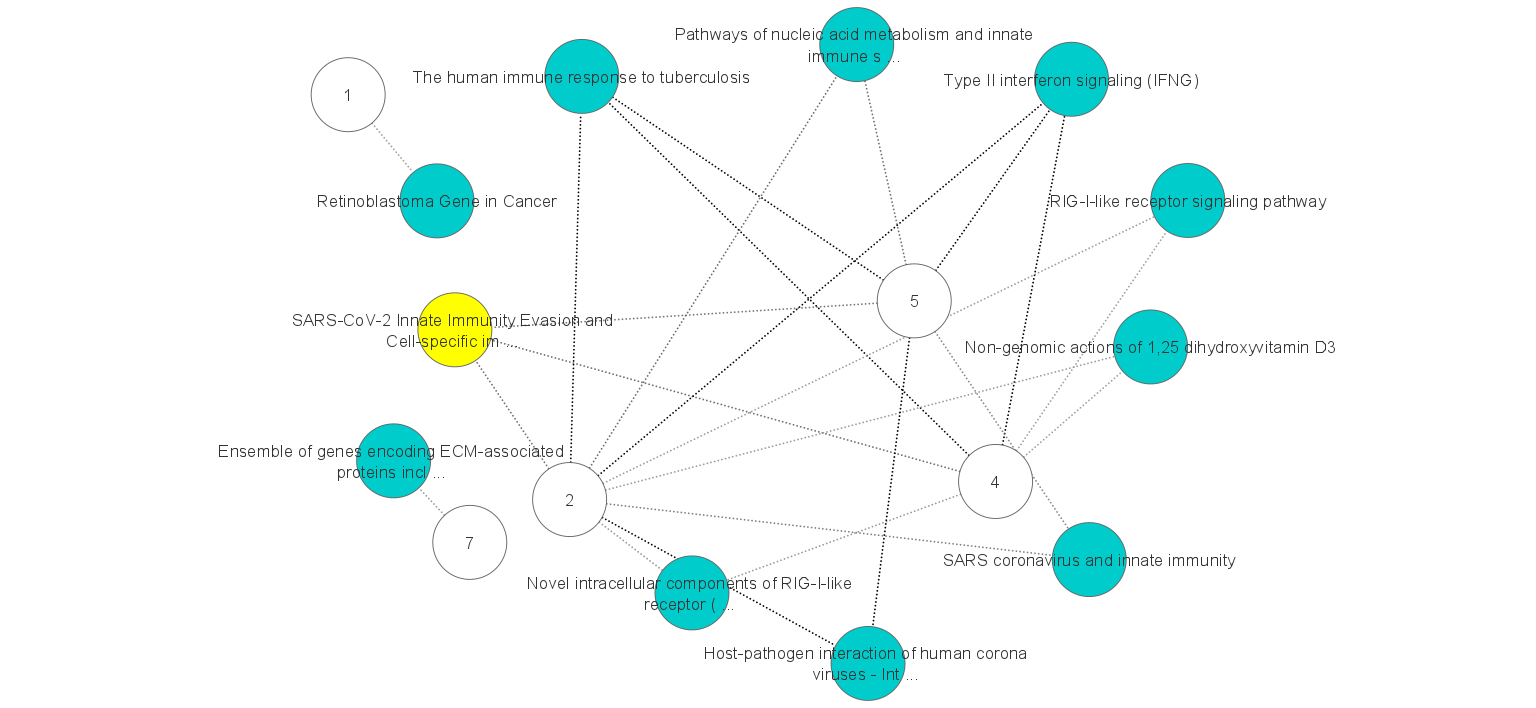 Performing gene set enrichment analysis to annotate a set of HVGs obtained from each cluster reveals biomarker genes involved in different gene ontology terms. Pathways that are enriched by marker genes are shown in the figure (right). Numbers show the clusters and edges show the links between clusters and pathways. Nodes highlighted in yellow show the SARS-CoV-2 cell-specific pathway. Most of the other green nodes reveal shared and cluster-specific functional pathways in the immune system.
Further details can be found in our publication and presentation at 2020 IEEE International Conference on Bioinformatics and Biomedicine (BIBM).
Performing gene set enrichment analysis to annotate a set of HVGs obtained from each cluster reveals biomarker genes involved in different gene ontology terms. Pathways that are enriched by marker genes are shown in the figure (right). Numbers show the clusters and edges show the links between clusters and pathways. Nodes highlighted in yellow show the SARS-CoV-2 cell-specific pathway. Most of the other green nodes reveal shared and cluster-specific functional pathways in the immune system.
Further details can be found in our publication and presentation at 2020 IEEE International Conference on Bioinformatics and Biomedicine (BIBM).
Relevant publications:
- A. Vasighizaker, S. Danda, L. Rueda. Discovering Cell Types Using Manifold Learning and Enhanced Visualization of Single-cell RNA-Seq Data, Scientific Reports 120 (12), 2022, In press. DOI: https://doi.org/10.1038/s41598-021-03613-0.
- S. Danda, A. Vasighizaker, L. Rueda. (2020), Unsupervised Identification of SARS-CoV-2 Target Cell Groups via Nonlinear Dimensionality Reduction on Single-cell RNA-Seq Data , IEEE International Conference on Bioinformatics and Biomedicine (BIBM 2020), Seoul, Korea (South), pp. 2737-2744.
- A. Vasighizaker, S. Hora, Y. Trivedi, L. Rueda, “Supervised Cell Type Heterogeneity Detection in Single-cell RNA-seq Data”, International Work-Conference on Bioinformatics and Biomedical Engineering (IWBBIO 2022), Gran Canaria, Spain.
- A. Vasighizaker, Saiteja Danda and Luis Rueda, “Discovering cell types using manifold learning and enhanced visualization of single-cell RNA-Seq data”, Highlight Track, The 13th ACM Conference on Bioinformatics, Computational Biology, and Health Informatics (ACM-BCB 2022), Chicago, IL.
- A. Vasighizaker, Saiteja Danda and Luis Rueda, “Discovering cell types using manifold learning and enhanced visualization of single-cell RNA-Seq data", Highlight Paper, 21st European Conference on Computational Biology (ISMB/ECCB 2022), Sitges, Barcelona.
- A. Vasighizaker, S. Danda, G. Peralta-Milla, L. Rueda. “Cell Type Identification on Single-cell RNA-Seq Data via Modified Locally Linear Embedding”, 25th Annual International Conference on Research in Computational Molecular Biology (RECOMB 2021), Padua, Italy. Poster presentation, peer-reviewed.
- A. Vasighizaker, L. Zhou, L. Rueda. “Cell Type Identification via Convolutional Neural Networks and Self-Organizing Maps on Single-Cell RNA-Seq Data”. Machine Learning Models for Multi-omics Data Integration Workshop (MODI 2021), in conjunction with the 10th ACM Conference on Bioinformatics, Computational Biology (ACM BCB 2021), Virtual, 2021.
- A. Vasighizaker, L. Zhou, L. Rueda, “Prediction of Human Pancreas Cell Types via ConvNet on Two-dimensional Mapping of Single-cell RNA-seq Data”, 29th Conference on Intelligent Systems for Molecular Biology - 18th European Conference on Computational Biology (ISMB/ECCB 2021), 2021. Virtual. Poster presentation, peer-reviewed.
Single-cell RNA-seq Data Analysis - Prediction of cell-cell interactions
Cell-cell interactions regulate organismal development, homeostasis, and single-cell functions. The disease occurs when cells do not interact properly or decode molecular messages improperly. Thus, identifying and quantifying intercellular signaling pathways has become a common analysis carried out across a variety of fields. We introduce a pipeline to identify cell-cell interactions using graph convolutional networks. Pipeline steps include pre-processing of the data, followed by cell-graph construction, and then identifying cell-cell interactions using graph convolutional networks.
The datasets can be found at https://www.ncbi.nlm.nih.gov/geo/query/acc.cgi?acc=GSE84133 and the code is publicly available at Github https://github.com/sheenahora/SEGCECO and Code Ocean DOI: 10.24433/CO.7099053.v1.

Relevant publications:
- S. Hora, A. Vasighizaker, L. Rueda, SEGCECO: Subgraph Embedding of Gene expression matrix for CEll cell COmmunication prediction, 26th International Conference on Research in Computational Molecular Biology (RECOMB 2022), San Diego, CA, United States.
- A. Vasighizaker, S. Hora, L. Rueda, A Novel Method to Predict Intercellular Signaling in Single-cell RNA-seq Data via Graph Convolutional Network, 30th Intelligent Systems for Molecular Biology (ISMB 2022), Madison, Wisconsin, United States.
Network Biomarkers
We have proposed a machine learning approach that is used to identify network biomarkers. We have applied our approach to identify such biomarkers in different subtypes of breast cancer, achieving excellent results in prediction of the subtypes, as well as identifying a few biomarkers. We have been able to identify network biomarkers and driver genes for each specific breast cancer subtype. Our results show that the resulting network biomarkers can separate one subtype from the others with very high accuracy. On a more recent work, we have utilized the machine learning approach to identify network biomarkers in breast cancer survivability. Given a breast cancer dataset of patients with different subtypes, we devised a novel network-based approach by integrating protein-protein interaction network (PPI) with gene expression data (1) to identify the network-biomarkers (metagene) of breast cancer survivability and (2) to predict the survivability of breast cancer patients based on subtypes. Our method uses the concept of seed gene for identification of network-biomarkers, ADASYN to solve class imbalance and random forest to predict survivability of patients. We obtained best classification performance with distance three from seed gene protein where the Gmean, f1-measure and accuracy are respectively 0.900, 0.800 and 90.34%, and using a maximum of 34 genes to predict survivability of patients. The dataset can be downloaded from this link. Work in collaboration with A. Ngom.
Relevant publications:
- S. Jubair, A. Alkhateeb, A. Abou Tabl, L. Rueda, A. Ngom (2019). Identifying subtype specific network-biomarkers of breast cancer survivability. BMC Bioinformatics Suppl, 2019. In Press. The dataset can be downloaded from this link.
- F. Firoozbakht, I. Rezaeian, M. D'Agnillo, L. Porter, L. Rueda, A. Ngom. An integrative approach for identifying network biomarkers of breast cancer subtypes using genomics, interactomics and transcriptomics data, Journal of Computational Biology, 2017, 24(8):756-766, doi: 10.1089/cmb.2017.0010.
ChIP-Seq and RNA-Seq Data Analysis
 Chromatin immunoprecipitation followed by high-throughput sequencing (ChIP-Seq) is a technique that provides quantitative and genome-wide mapping of target protein binding events. In ChIP-Seq, a protein is first cross-linked to DNA and the fragments subsequently sheared. Detecting protein binding sites from massive sequence-based datasets with millions of short reads is a bioinformatics challenge that requires considerable computational resources and specialized, in spite of the availability of efficient tools for ChIP-chip analysis.
One of the problems we are working on is on detecting biologically significant peaks in ChIP-Seq data by using an optimal algorithm for optimal multi-level thresholding (OMT). Most of the existing methods use a set of parameters that may cause variations of the results for different datasets. In our method, both of these issues have been addressed by proposing a new peak finder algorithm based on optimal multi-level thresholding coupled with a model to find the best number of peaks based on clustering techniques for pattern recognition. The algorithm can be extended to find significant enrichment regions in RNA-seq data too. Some applications like detecting alternative splicing sites in RNA-seq data for prostate cancer are currently being studied (see below).
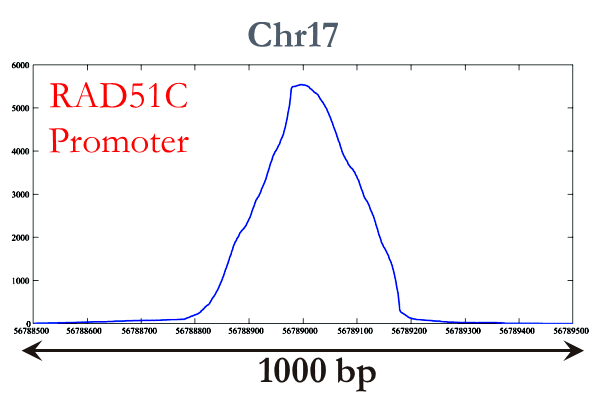
We have tested our algorithm in a variety of datasets that include FoxA1 dataset, which contains experiment and control samples of 24 chromosomes, and four transcription factors with a total of 6 antibodies for Drosophila melanogaster (available at the GEO database, accession no. GSE20369). OMT has been able to find important binding sites like the RAD51C Promoter on the FoxA1 dataset (figure on the right). The enriched region (peak) is clearly detected by OMT. Our recent publications and presentations at BIBM 2012 and ACM-BCB 2012 provide more details for these results.
Relevant publications:
- I. Rezaeian, L. Rueda (2012). A New Algorithm for Finding Enriched Regions in ChIP-Seq Data. ACM Conference on Bioinformatics, Computational Biology and Biomedicine (ACMBCB 2012), Orlando, FL, USA, pp. 282-288.
- I. Rezaeian, L. Rueda (2012). Finding Enriched Regions and Genomic Features in ChIP-Seq Data. 5th IEEE International Conference on Bioinformatics and Biomedicine (BIBM 2012), Philadelphia, PA, USA, pp. 487-490.
The Role of Alternative Splicing in Prostate Cancer
 Prostate cancer is a very complex disease, and diagnosis is becoming progressively more prevalent. Worldwide, prostate cancer is the second most common cancer in men. In Canada, this form of cancer claimed the lives of about 4,000 men in 2012. Prostate cancer is among the four most common types of cancer in Ontario, which collectively account for 54 percent of all cancers in the province.
Studying prostate cancer at the molecular level helps researchers uncover the genetic regulatory mechanisms involved in the tumour biology. One of the important tasks that prostate cancer researchers face is to discover biomarkers that help distinguish between benign and malignant tumours, different subtypes, and progression. This is of great significance, since the lack of reliable biomarkers to distinguish, at early stages, tumours that are not likely to grow from those that are most likely to grow is a major challenge in prostate cancer treatment. As such, men with low-risk prostate cancer are often unnecessarily over-treated.
The advent of next generation sequencing like RNA-seq can read the transcriptome at a remarkable single-nucleotide resolution, generating millions or billions of short sequences or reads which have to be assembled and analyzed. A traditional way to study the transcriptome is to find the role of certain genes (as biomarkers). However, due to alternative splicing mechanisms, each gene has many different ways of expressing itself into different protein products or isoforms. These can be detected on the RNA-seq data produced, but only if found in the blender.
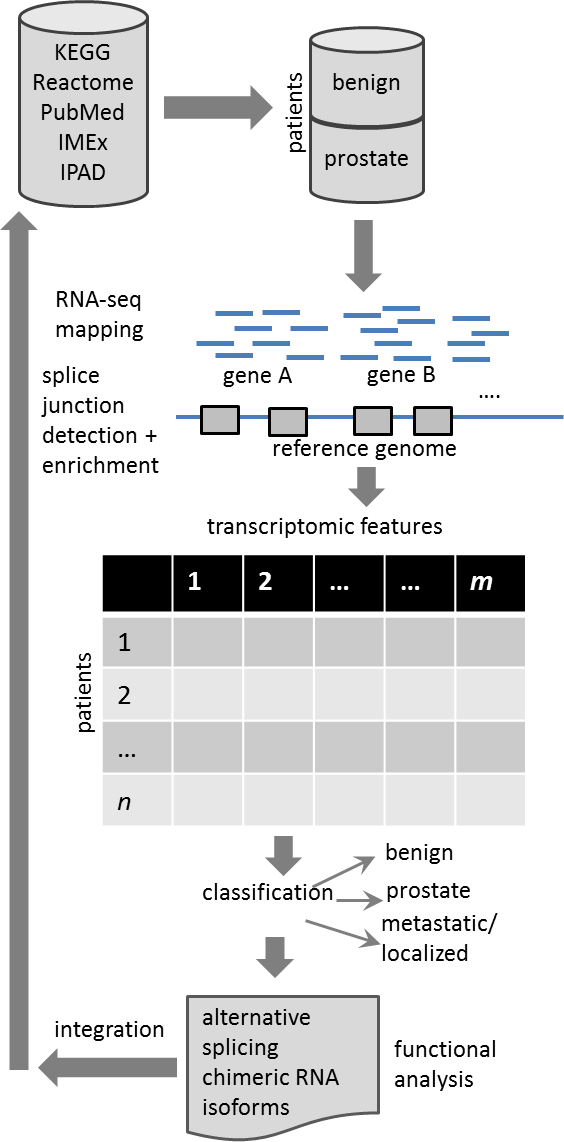
Our current research focuses on studying the transcriptional mechanisms involved in prostate cancer, with particular emphasis on known and de novo cis and trans RNA alternative splicing and their associated noncoding RNAs that differentiate between benign tumors of the prostate and prostate cancer. Using machine learning algorithms on RNA-seq public datasets from the most recent studies in prostate cancer, we aim to (i) identify alternative splicing events associated with prostate cancer (localized and metastatic) and its differentiation between high-risk and low-risk progression, and (ii) understand the functional mechanisms of the tumor biology implied by the identified splicing events, isoforms and noncoding RNAs, and their related processes like transcription factors, signaling pathways and cellular proteins.
The main approach for data collection, analysis, visualization and interpretation is based on current methods for RNA-seq data analysis, machine learning techniques for prediction and unsupervised clustering and feature selection methods for biomarker detection. A simplified view of the model is shown in the figure on the right We are also incorporating data integration approaches used for comparison, integration and validation of biomarkers across different types and datasets. For splice junction detection, alternative splicing analysis and enrichment, we are using mostly TopHat2, PASSion, and our recently developed tool for ChIP-seq and RNA-seq data analysis, OMT (more details above). An approach to compare and integrate data from different sources and cases (pathways, diseases, drugs, organs and tissues) will help validate the new biomarkers found along with existing transcriptomic biomarkers.
We have proposed a new algorithm for finding differential splice junction events on a two-dimensional histogram. We have identified a small subset of differential junctions for which we are currently investigating the corresponding protein isoforms, function and pathways associated with them. We have been awarded a Seeds4Hope grant by the Windsor-Essex County Cancer Centre Foundation. Latest story in the Windsor Star.
Biomarker Discovery in Breast Cancer Subtypes and Survivability
 Recent studies in breast cancer shows that tumour tissues can be grouped into at least 5 different subtypes based upon different genome-wide and pathological studies: normal breast-like, basal, luminal A, luminal B and ERBB2+. These subtypes have been demonstrated to be predictive of overall prognosis and response to specific chemotherapy regimens. Accurately classifying patient populations into these subtypes in a clinical setting helps significantly in guiding diagnosis, treatment and prognosis. To be a highly used clinical tool requires identifying a small subset of genes that reduces the cost of monitoring and screening patients. But a small set of genes may reduce the accuracy of prediction and hence diagnosis and follow-up.
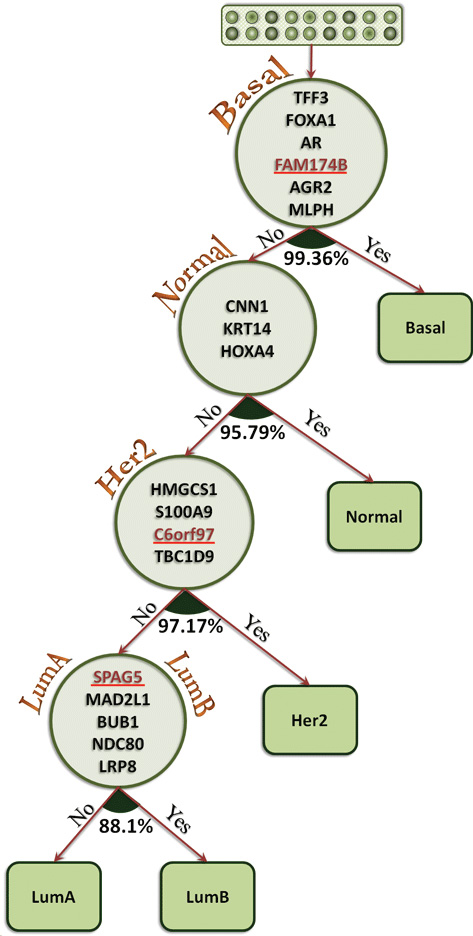
In one of our recent studies, we have proposed a hierarchical model (see figure on the right) in which each patient is assigned to the corresponding subtype based on the set of genes that have been optimally assigned to each particular node in the tree. We have considered high-throughput microarray-data from previous studies of Hu's et al., which contains 137 samples, each pre-classified and associated with one of the five different subtypes. First, a gene selection method is used to find the subset of genes with best ratio of accuracy/gene number. Using these genes, the samples are classified and the subtype with the best prediction accuracy is selected as the target node on that level (e.g. basal for the root). After removing samples corresponding to that class, the process is repeated for the rest of samples and the subset of genes is used to determine the next nodes in the same step by step process.
Following this approach all samples are classified into one of the subtypes. We have been able to reach very high prediction accuracy, resorting only on a very small subset of genes. Our results show that using only 18 genes the model is able to classify cancer subtypes for each patient correctly with accuracy higher than 95%. Moreover, 15 out of the 18 selected genes are related to the cancer subtypes based on previous studies. The work has also been funded by a Seeds4Hope grant by the Windsor-Essex County Cancer Centre Foundation.
Relevant publications:
- I. Rezaeian, Y. Li, M. Crozier, E. Andrechek, A. Ngom, L. Rueda, L. Porter (2013). Identifying Informative Genes for Prediction of Breast Cancer Subtypes. 8th IAPR International Conference on Pattern Recognition in Bioinformatics (PRIB 2013), Nice, France. pp. 138-148.
- A. Abou Tabl, A. Alkhateeb, W. El-Maraghy L. Rueda, A. Ngom. A machine learning approach for identifying gene biomarkers guiding the treatment of breast cancer. Frontiers in Genetics", 2019. In Press.
Prediction of microRNA
MicroRNAs are a class of small non-coding RNAs that play a crucial role in gene regulation by perfectly or imperfectly binding into three prime untranslated regions (30 UTR) in messenger RNAs, and cause repression of translating mRNAs into proteins or their cleavage. Researchers have estimated that about one third of the human genes are regulated by microRNAs. MicroRNAs perform many cellular tasks in cells including controlling cell developmental timing, cell death and stem cell characterization. Many studies have shown that malfunction of microRNAs may have serious effects on cell life and may cause different types of cancer, heart disease and nervous system disorder. Thus, identification of microRNA is an essential process in discovering microRNA functions and their role in cellular processes.
Two types of methods can be used to predict microRNA, experimental and computational approaches. Experimental approaches resort mostly on the most recent sequencing techniques and hence tend to be costly. Various computational approaches have been proposed for prediction of microRNA. One of the main problems encountered in this problem is the imbalance between the positive and negative classes. We have proposed an approach, miLDR-EM, which combines linear dimensionality reduciton (LDR) with explicit mapping onto higher dimensions to classify precursor microRNAs from both pseudo hairpins and other non-coding RNAs. LDR+EM combined with feature selection has been shown to yield excellent performance, better than previous methods, on a dataset of 691 non-redundant human pre-microRNA and 8,494 human pseudo hairpin sequences. By using only three features for normalized/ensemble free energy, miLDR-EM reaches very high prediction accuracy and a geometric mean of 92.20%, which is an excellent performance for a class imbalance problem.
Relevant publications and presentations:
- N. Shakiba, L. Rueda (2013). MicroRNA Identification Using Linear Dimensionality Reduction with Explicit Feature Mapping. BMC Bioinformatics. Presented at GLBIO 2012.
Microarray Data Analysis
We have studied the main aspects of microarray data analysis, with emphasis on DNA microarray image gridding and segmentation, as well as gene selection, biomarker detection and clustering time-time series gene expression data. I have contributed to the field of microarray image and data analysis for more than ten years. The most recent contributions and results are listed below.
DNA Microarray gridding: We have proposed a hill-climbing approach for gridding DNA microarray images, and a new polynomial-time algorithm for optimal multilevel thresholding for solving the same problem with almost perfect accuracy, while being free of parameters. My recent book on Microarray Image and Data Analysis by CRC Press includes some of these contributions. Relevant publications:
- L. Rueda, I. Rezaeian (2011). A Fully Automatic Gridding Method for cDNA Microarray Images. BMC Bioinformatics, 12:113. Presented at CIARP 2011 (keynote), MWC 2011 (invited), ACM-BCB 2011, BIBM 2010 and PRIB 2010.
- L. Rueda and V. Vidyadharan (2006). A Hill-climbing Approach for Automatic Gridding of cDNA Microarray Images. IEEE/ACM Transactions on Computational Biology and Bioinformatics, 3(1):72-83.
Clustering of Microarray Time-series Data: I have pioneered the model for pairwise and multiple profile alignment for time-series gene expression data. In this work, we proposed a universal alignment model used to represent time-series gene expression data, which is independent of the clustering algorithm being used. Relevant publications:
- N. Subhani, L. Rueda, A. Ngom, C. Burden (2010). Multiple Gene Expression Profile Alignment for Microarray Time-series Data Clustering. Bioinformatics, 26(18):2281-2288. Presented at ACM-BCB 2010, CIBCB 2010 and BIBM 2009.
- L. Rueda, A. Bari, A. Ngom (2008). Clustering Time-series Gene Expression Data with Unequal Time Intervals. Springer Trans. on Computational Systems Biology, LNBI 5410, pp. 100-123.
Other contributions: We have proposed pattern recognition models based on clustering and supervised classification for DNA microarray image segmentation. We have also proposed heuristics for oligonucleotide selection, new approaches for gene selection and missing values, and optimizing the parameters of fuzzy k-means for microarray data clustering.
Relevant publications:
- A. Ngom, L. Rueda, L. Wang, R. Gras (2010). Selection Based Heuristics for the Non-Unique Oligonucleotide Probe Selection Problem in Microarray Design. Pattern Recognition Letters, 31(14): 2113-2125.
- Y. Li, A. Ngom, L. Rueda (2010). Missing Value Imputation Methods for Gene-Sample-Time Microarray Data Analysis. IEEE Symposium on Computational Intelligence in Bioinformatics and Computational Biology (CIBCB 2010), Montreal, Canada, pp. 183-189.
- W. Yang, L. Rueda and A. Ngom (2007). On Finding the Best Parameters of Fuzzy k-Means for Clustering Microarray Data. Multiple-Valued Logic and Soft-Computing Journal, 13(1/2):145-178.